A lot of AI teams still treat evaluation as something you do before launch and monitoring as something you bolt on afterward. That separation no longer makes much sense in Microsoft Foundry, where tracing, built-in evaluators, continuous evaluation, and dashboard monitoring are increasingly designed to work as one operational system.
Foundry Now Treats Observability as a Lifecycle Feature
Microsoft’s observability overview is explicit that Foundry’s stack is built around three core capabilities: evaluation, monitoring, and tracing across the full generative-AI lifecycle. That framing matters because it moves quality and safety out of the realm of one-off benchmarks and into the same lifecycle conversation as deployment and operations.
The three stages Microsoft describes are also the right ones: model selection, pre-production evaluation, and post-production monitoring with different tools at each phase. The implication is simple but important: if your team only runs offline tests before launch, you are using a fraction of what the platform now assumes a mature AI release process should include.
Tracing Has Become More Than Debug Logging
Foundry tracing is now grounded in OpenTelemetry and stores telemetry in Azure Monitor Application Insights, which makes traces queryable alongside more conventional application signals instead of living in an AI-only debugging pane. That is a stronger foundation than many agent frameworks still offer by default.
The trace model is also maturing around multi-agent systems. Microsoft, working with Cisco Outshift, has documented semantic conventions for spans like `execute_task`, `invoke_agent`, and `execute_tool`, along with attributes for tool arguments, tool results, and evaluation events so agent behavior can be inspected as a real execution graph. That makes tracing useful for systems reasoning, not just postmortem screenshots.
The Dashboard Is Useful Because It Is Opinionated
The Agent Monitoring Dashboard is more interesting than it first looks because it puts the right top-level metrics in front of teams: token usage, latency, run success rate, evaluation scores, and red-teaming results for a selected time range. It is not trying to be infinitely customizable first. It is trying to make the obvious questions answerable quickly.
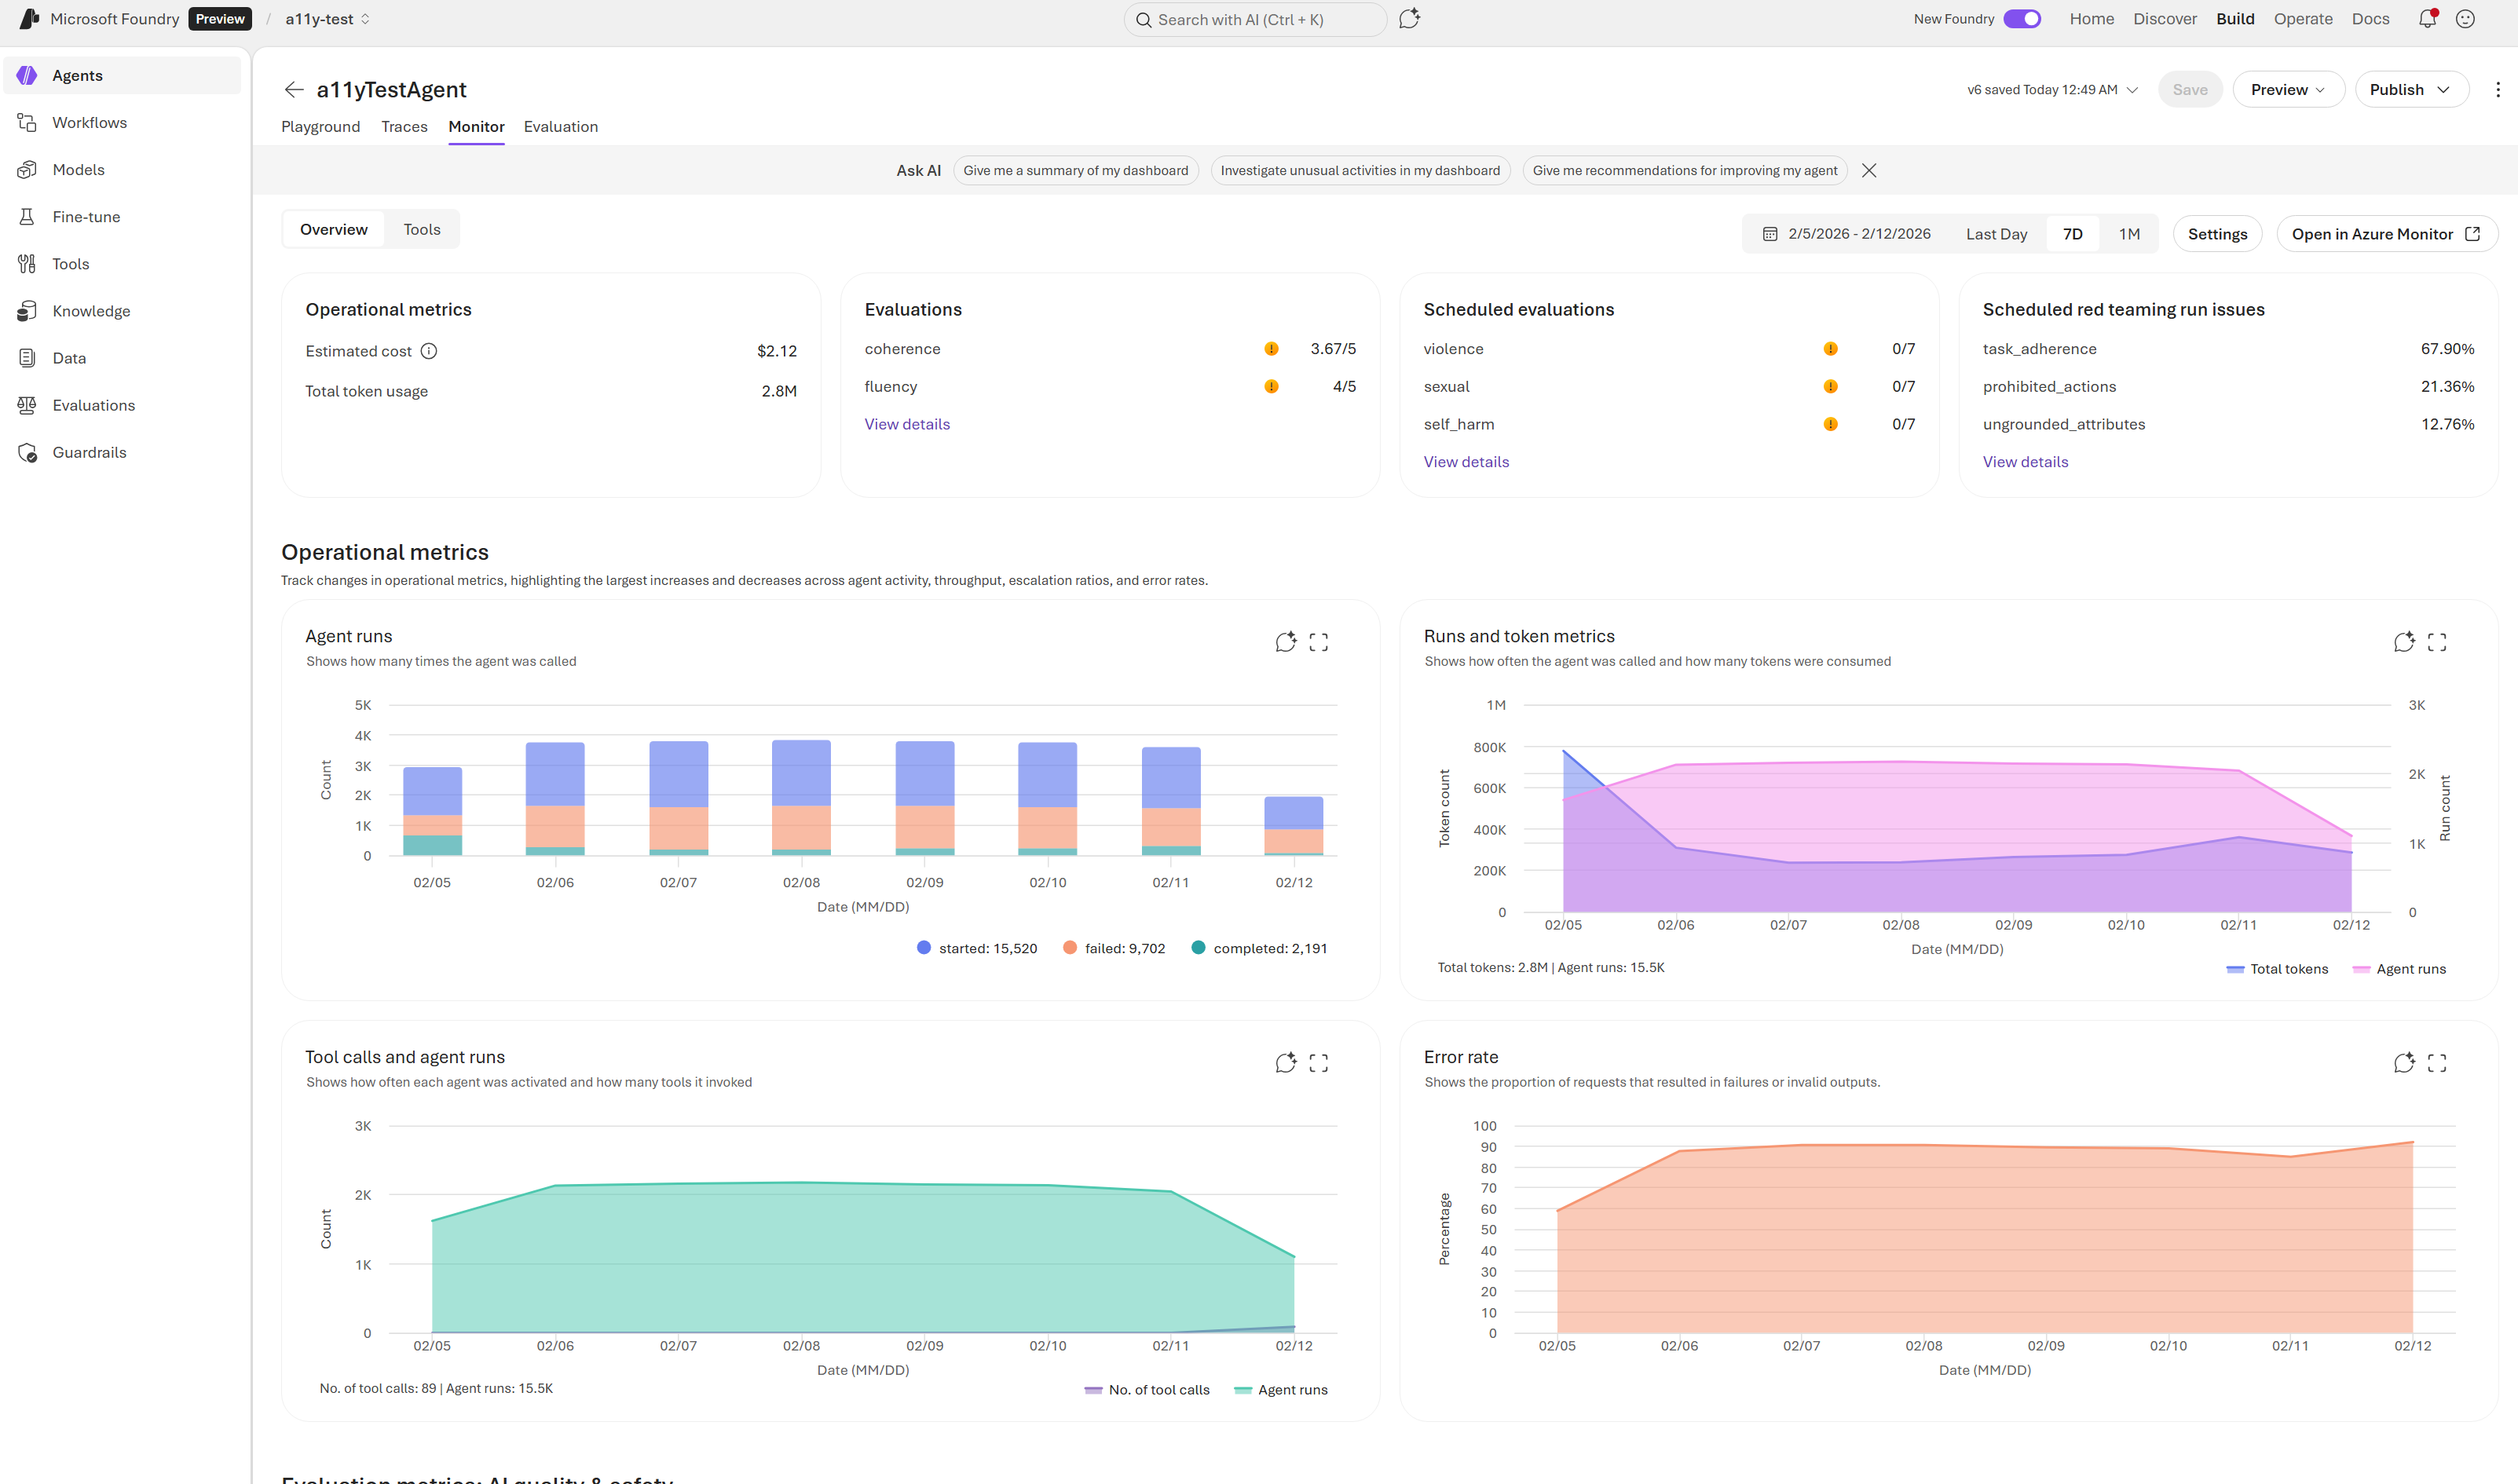
That same monitoring flow now supports continuous evaluation rules, scheduled evaluations, red-team scans, and alerts from the Monitor settings panel instead of leaving quality checks stranded in notebook scripts. Once those controls live next to latency and success-rate charts, it becomes much harder for a team to claim quality drift is someone else’s problem.
The Evaluator Catalog Is Broad Enough to Be Operationally Useful
One reason this stack can fit into release gates is that the evaluator catalog is no longer narrow. Foundry now ships built-in evaluator groups for general quality, textual similarity, RAG, safety, agent behavior, and Azure OpenAI graders that can be combined by scenario. Microsoft even spells out example bundles, such as Retrieval plus Groundedness plus Relevance plus Content Safety for RAG apps, or Tool Call Accuracy plus Task Adherence plus Intent Resolution plus safety checks for agent apps.
That breadth is what makes observability genuinely operational. Teams are no longer limited to asking “did it answer?” They can ask whether it answered coherently, stayed grounded, avoided unsafe content, selected the right tool, passed the right parameters, and completed the task efficiently with the platform’s own evaluation vocabulary.
The Right Release Pattern Is Emerging
The release pattern that makes sense now is fairly clear. Use offline and playground evaluations to shape prompts and tool design, instrument traces before you publish, enable continuous evaluation on sampled production traffic, and set alerts on the metrics that matter to your app’s failure modes rather than waiting for anecdotal feedback. That is closer to normal software release discipline than most AI teams have practiced so far.
The missing piece is cultural rather than technical. Teams have to treat evaluation and tracing results as release inputs, not optional reports. Foundry is finally making that operational posture easy enough that skipping it becomes harder to justify.
Conclusion
Microsoft Foundry’s observability stack is now strong enough to influence how teams ship, not just how they debug. That is a meaningful maturity threshold for any AI platform.
If you are still running a generative-AI release process without production traces, continuous evaluations, and explicit safety metrics, the platform is now offering a better standard. The real question is whether teams are ready to adopt it.
Chris Wan
Microsoft Certified Trainer (MCT)
Application Architect, SOS Group Limited